Editing the Design of a Graph
Editing the Design of a Graph
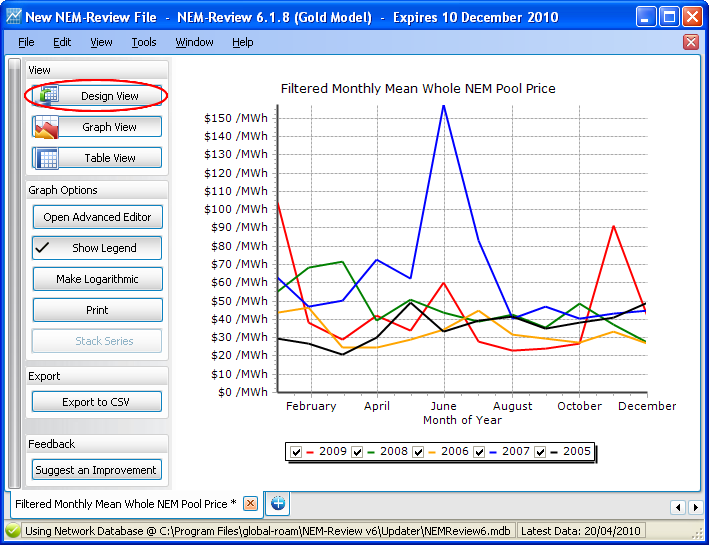
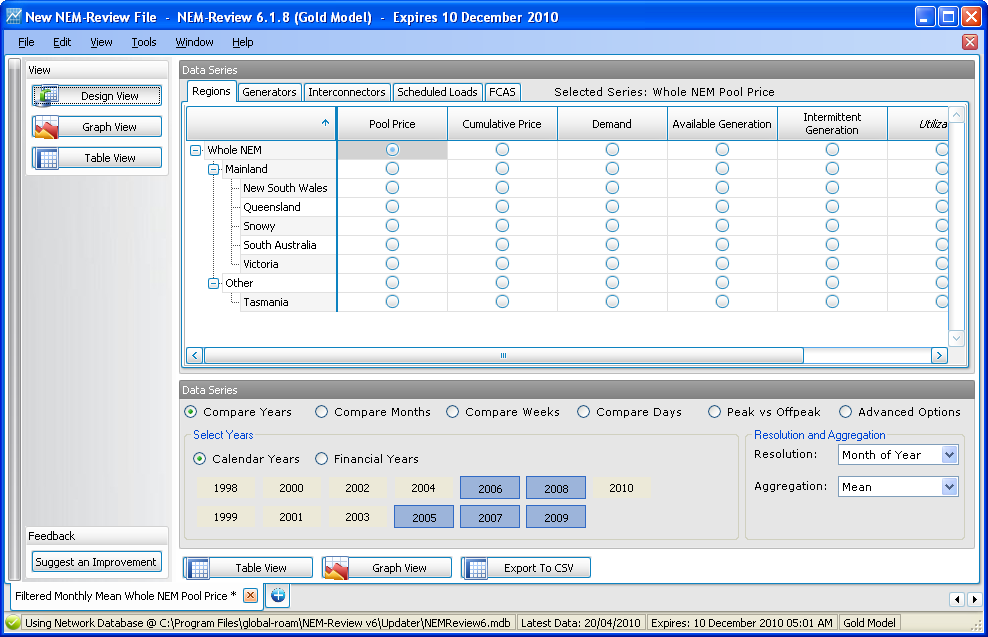
Once you've created a graph you can go back and edit the data and time ranges to display by clicking the Design View button in menu on the left hand side of the screen.

This will return you to the Design View - the same screen you used to create your graph.
For more information on the Design View screen, select the type of graph you are editing:
Trending Graph
Chronological Subseries Graph
Scatter Graph
Distribution Graph
Once you're done editing your graph design, click the Graph View button to display the updated graph:

or Table View to see the data behind the graph: