Creating a Chronological Subseries Graph
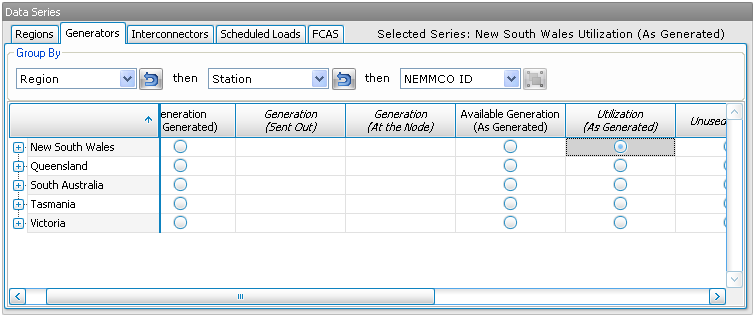
1. Select a Data Series
Select the single data series you would like to display. Hold your mouse over an option selector to see a description of the data series.
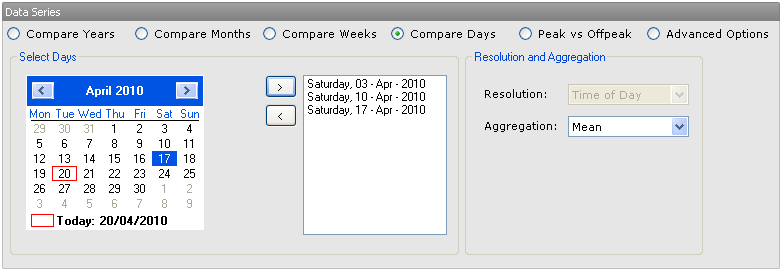
2. Select Date Ranges
Next, select the date ranges you wish you compare. The first five option buttons (compare years, compare months, etc.) allow you to quickly select common time ranges to compare. Select Advanced Options for complete control over selection of time ranges, down to the trading interval (half hour).
3. Generate the Graph
Finally, click the Graph View button to generate your graph.

Alternatively, click Table View to view the data behind the graph in a table in NEM-Review. Export To CSV will save the data in a csv file, ready to open in excel for further analysis.
Next, find out how to manipulate your graph or table.