Creating a Trending Graph or Selecting Data
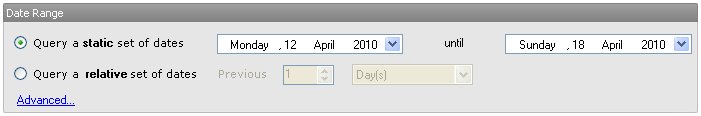
1. Select a Date Range
Choose the time interval for which you want to view data. Click Advanced... for more options.
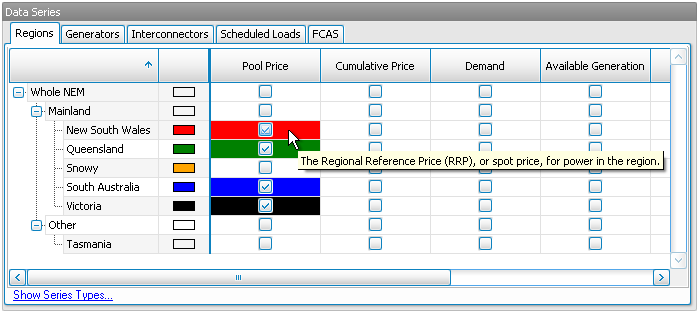
2. Select Data Series
Select the data series you would like to display. Hold your mouse over a checkbox to see a description of the data series.
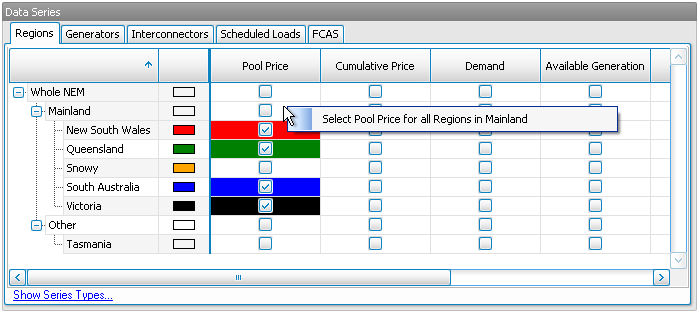
To select all dataseries within a group (e.g. all regions on the mainland), right click the data series checkbox for the group and select the action you wish to perform.
3. Edit Selected Data Series
Select the resolution at which to display data (e.g. show data for each trading period, or hour, or day, etc), and the method of aggregating data (e.g. min, max, mean, etc).
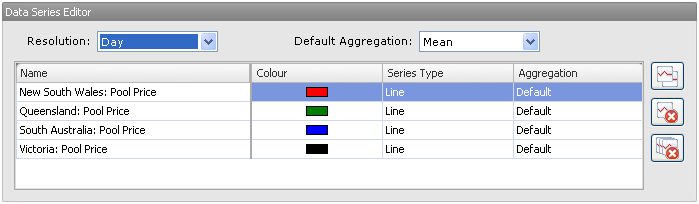
You can also set the series type (line, bar, area, etc) and aggregation for individual data series. Use the buttons on the right to duplicate or delete data series.
4. Generate the Graph or Table
Finally, click the Graph View button to generate your graph, or click Table View to view the data behind the graph in a table in NEM-Review.

Alternatively, Export To CSV will save the data in a csv file, ready to open in excel for further analysis.
Next, find out how to manipulate your graph or table.