Creating Graphs and Querying Data
To start a new analysis project, open the NEM-Review Analysis Client. A new file will be created for you, ready to start your analysis.
In NEM-Review, click the type of graph to create. If you only need the data (not a graph) choose the Trending Graph.
Click a link below for more instructions.
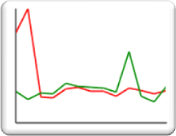
Select multiple data sets over a single timespan.
|
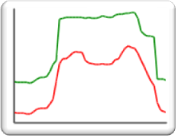
Compare a single data set over multiple time spans.
|
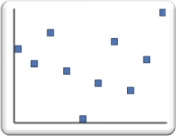
Plot two datasets against each other to show correlations.
|
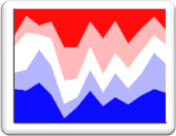
Show the distributions of values in a single dataset.
|