Customising the Appearance of a Graph
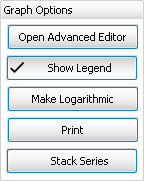
Once you have designed your graph and are happy with the data you have selected, you can customise the way your graph looks with the Graph Options menu, on the left side of the screen in Graph View.
Here you can quickly access the common functions of hiding/showing the legend, displaying the graph on a logarithmic scale, and stacking the data series to show how each series contributes to the total of all series.
Advanced Editor
Almost every aspect of the appearance of your graph can be customised through the Advanced Graph Editor.
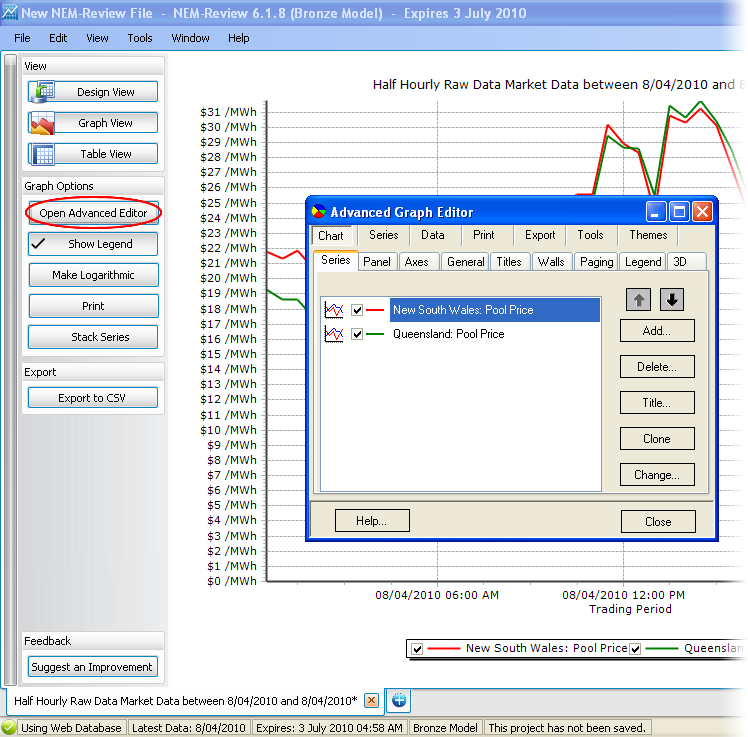
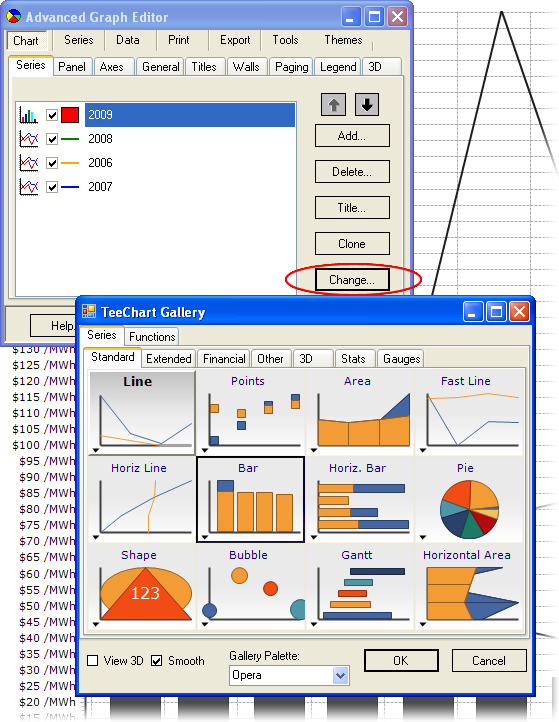
Series Tab
From the Series tab, you can rearrange, delete, clone, re-name or change the graph style of each series.
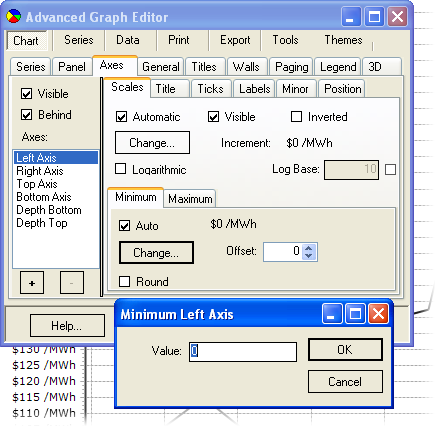
Axes Tab
From the Axes tab you can adjust the scale of the axes, the increment between value labels, the format of titles and labels, and other axis settings.