How to Analyse the Profit Margin on Coal Burnt at a Station
This guide will show you how to use the coal burnt and spot revenue data in NEM-Review to trend the "average revenue per tonne of coal burnt" for any station.
There are two key steps:
- In NEM-Review: Trend the monthly revenue and coal burnt for a station
- In Excel: Use this data to calculate the monthly average revenue per tonne
1. Trend monthly revenue and coal burnt
- Open your NEM-Review Analysis Client
- Click the Trending Graph button

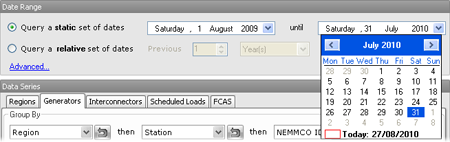
- In the Date Range selector, select from 1 August 2009 to 31 July 2010 (or any other date range that encompasses a series of full months).
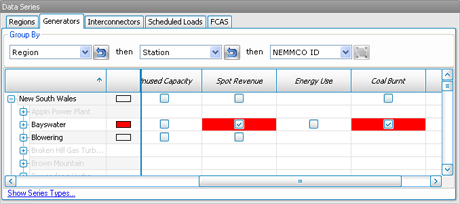
- In the Data Series selector, tick Spot Revenue and Coal Burnt for the station you are interested in.
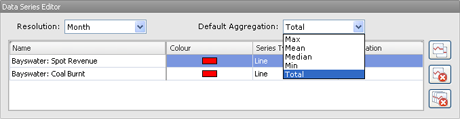
- In the Data Series Editor, set the resolution to Monthly and the Aggregation to Total.
- Click the Graph View button to take a look at the graph.

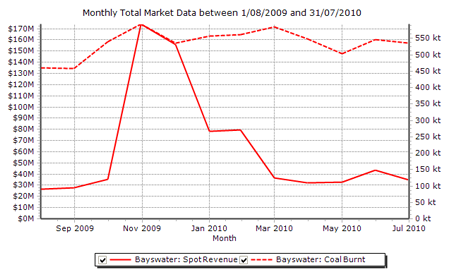
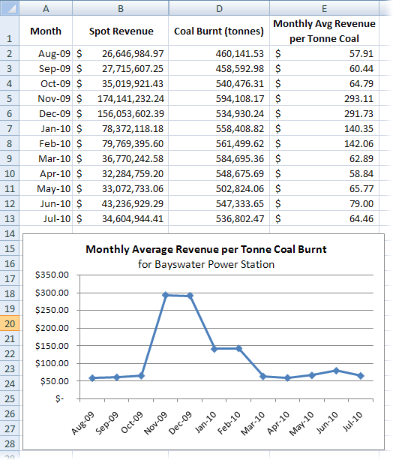
Note the significant increase in revenue over the summer months, independent of the amount of coal burnt.
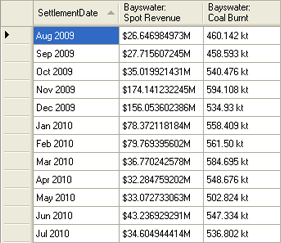
- Click the Table View button to view the data behind the graph.

2. Calculate monthly average revenue per tonne of coal burnt
- Still in table view, click the Hide Formatting button to show raw data without units or rounding.
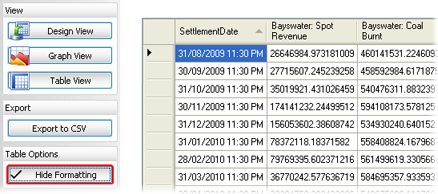
Note that the unformatted coal burnt data is in kg.
- Select the entire table by clicking in the grey space in the top left corner of the table (just left of the column headings).
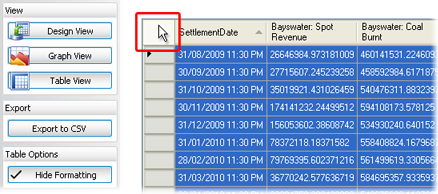
- On your keyboard, press and hold Ctrl then c at the same time to copy the data to your clipboard.
- Open a new Excel spreadsheet, and paste the data into it (press Ctrl+v or right click a cell and select Paste).
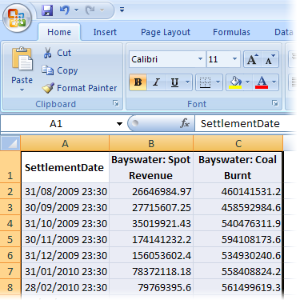
Column A should be the Settlement Date, column B the Spot Revenue, and column C the Coal Burnt. The first row will contain the column headings.
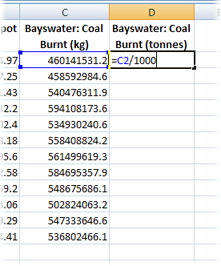
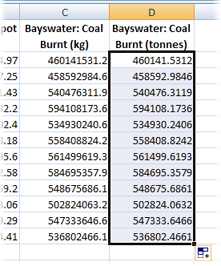
- In column D we will convert the coal burnt from kg to tonnes.
In cell D2 enter the formula =C2/1000 (divide the value in column C by 1000). Copy this formula to the rest of the cells below in column D.
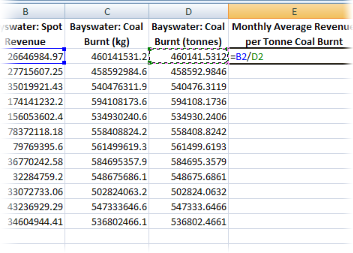
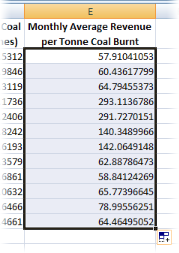
- In column E we will calculate the monthly average revenue per tonne coal.
In cell E2 enter the formula =B2/D2 (spot revenue / tonnes coal burnt). Copy this formula to the rest of the cells below in column E.
- If you wish, you can format your data and create a graph using Excel.